Update – Scroll tracking is now a default event tracked in the new Google Analytics 4 property. You don’t need to set this up on your own using GTM! Click here to read about GA4 (see also here and here), or contact us to help you get your GA4 property set up and tracking properly.
If you haven’t set up scroll depth tracking on your website through Google Tag Manager, what are you waiting for? You can get so much useful information from setting up this simple tag and trigger. You can use it to make your bounce rate more meaningful and to give you more information about your site’s top exit and bounce pages.
The easiest and quickest way to get started is to use the built in scroll depth trigger in Google Tag Manager. Keep in mind that this is for Universal Analytics, and if you’re using GA4, you can enable scroll tracking with Enhanced Management.
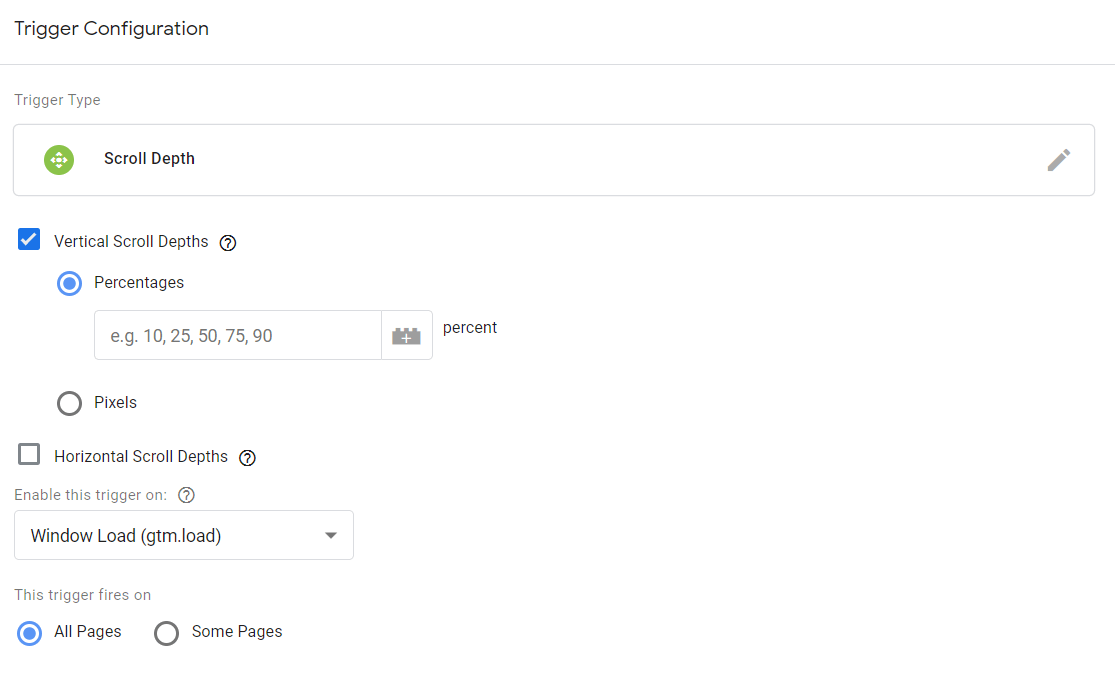
Just add a new trigger, select Scroll Depth as the trigger type, then start customizing it to your needs. Typically, you’ll be doing a vertical scroll depth by percentage, but you can also do horizontal scrolling or measure the scroll by pixels instead if your website needs it. Select percentage increments that are useful to you, or just start with 10, 25, 50, 70, 90 if you’re not sure. If you only need to track scrolling on certain pages, you can specify which pages, or simply leave it on “all pages.”
Next, go to your GTM variables, and click “Configure” for the built-in variables. Make sure your scroll depth variables are enabled.

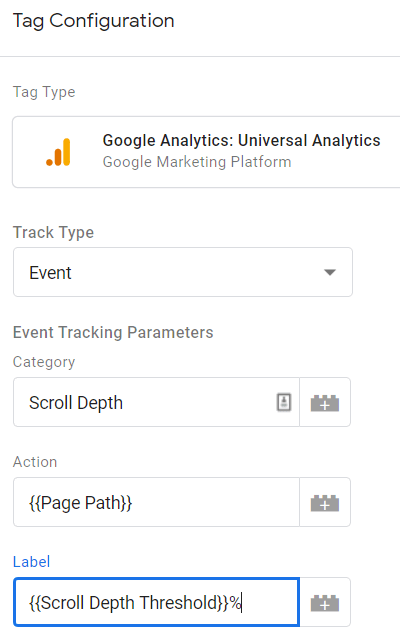
Next, set up a tag using the trigger you defined earlier. Make this tag a Universal Analytics event, and set your category, action, and label to suit your reporting needs. We like to set the category as “Scroll Depth,” the action as the page path variable, and the label as the scroll depth threshold variable followed by a “%.” Setting your event action and event labels like this will allow you to filter all scroll depth data by a specific page or by scroll depth, so you can see a list of which pages have users making it past a certain point. We love Google Data Studio for this type of analysis!
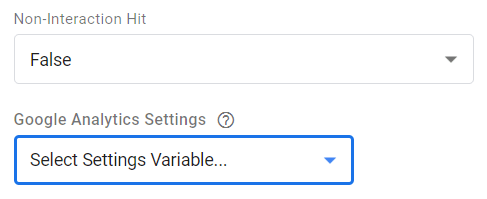
The last few settings are to select your Google Analytics account variable and define whether scroll depth is a non-interaction event. Select “False” if you want the scroll to negate the bounce rate by “counting” or “True” if you don’t want it to affect the bounce rate. Keep in mind that this will apply to all specified thresholds in your trigger, and because of this, sometimes we only choose thresholds beginning at 50% (always client and website specific). If you need more granular data, you can always split your thresholds into separate tag and trigger pairs, one pair for those thresholds that should count as an interaction, and another pair for those that should not count. Another option is to make these all thresholds non-interaction events, and create a separate tag and trigger using different event labels that will negate the bounce rate at a certain scroll depth of your choosing.
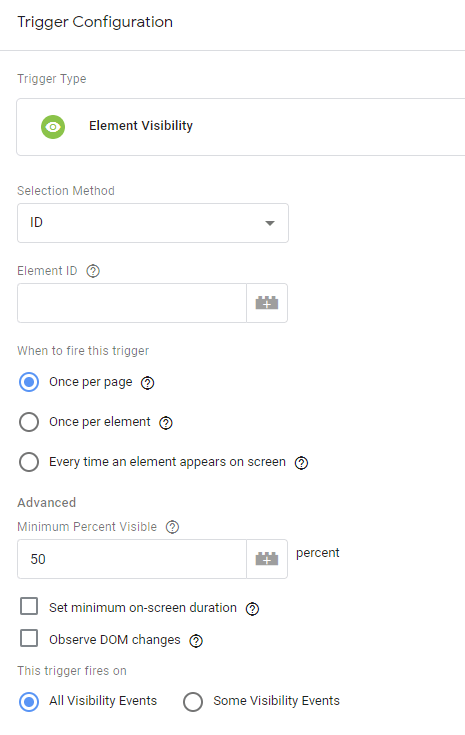
Stuck with us this far and want to get even more specific? You can set up Element Visibility triggers and find out how many times someone scrolls to a point where a certain html ID or CSS selector is visible. This is a little more time-consuming and complicated to set up correctly because there are so many amazing options to customize this tracking! We suggest doing this only on key pages or for key elements of tracking interest.
To set this up, make a new trigger, and select “Element Visibility” as the type. The selection method gives you a choice between ID and CSS selector. You’ll make this decision based on your website code and what specific elements are important to your tracking.
Here are some great resources for getting familiar with CSS selectors:
For the website in the example dashboard, we used IDs and set the trigger to fire only once per page because we wanted to know how far down people were scrolling. The default setting of minimum percent visible is good for most situations, and you can also specify a minimum on-screen duration (cumulative). If the web page changes dynamically after the initial load, you can check the box to observe DOM changes, so the tag will catch these changes and fire the trigger if applicable.
The final option lets you specify when to fire this trigger. You can change the selection to “some visibility events” and specify a certain page to fire the tag on, or any of the other methods of specification best suited for your needs. For the website in our example, we used this option to specify the two distinct pages that we were interested in.
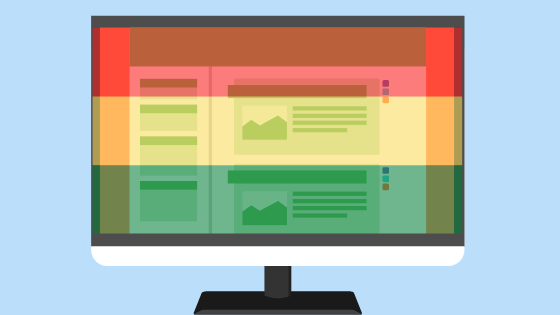
After setting up separate tags and triggers for each section of the two pages, we let the data roll in and were able to create this visualization for the store owner:
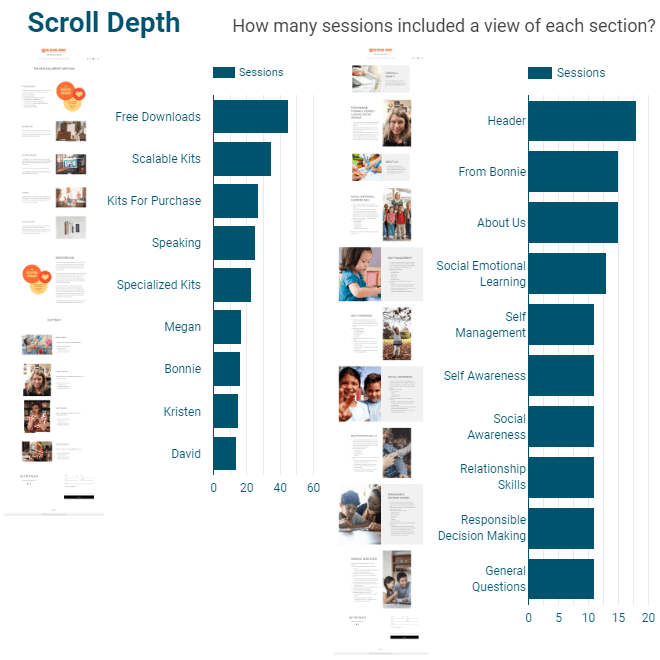
We chose to track these pages as element visibility rather than scroll depth percentage because the store owner had mentioned that she knew these pages were long and she wasn’t sure which sections were most interesting to users. If we had tracked by scroll depth percentage only, we would have had to make guesses about which sections were visible at a certain threshold. With element visibility, there’s no guesswork! Since these sections were split out into their own individual tags and triggers, we defined certain ones as non-interaction events, meaning a site visitor had to scroll to a certain section before it “counted.”
Once you have data like this, you can tie it all together in a conversion rate optimization analysis, identifying key changes to make on your website to get more leads, purchases, or whatever your business goals are!