If you’re just getting started with Google Analytics 4, you’ve probably noticed that the default reports are pretty different than the ones included in Universal Analytics! If you’re not able to find the specific combination of metrics and dimensions in the new reports, you can create custom reports AND save them to the left navigation panel for easy access.
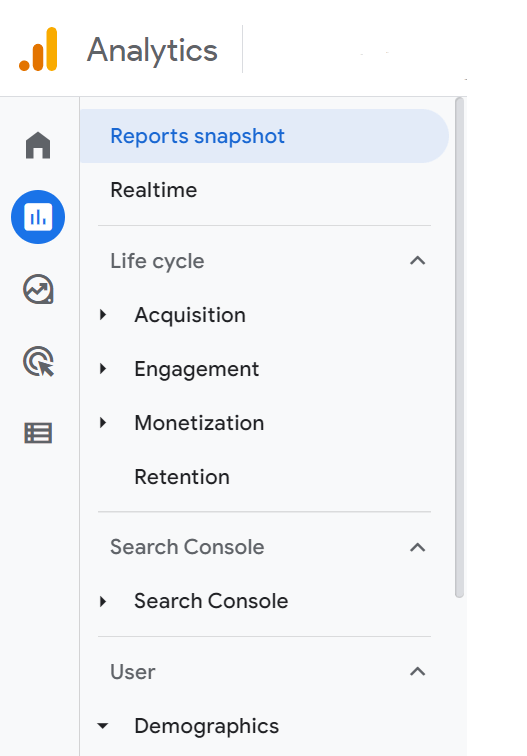
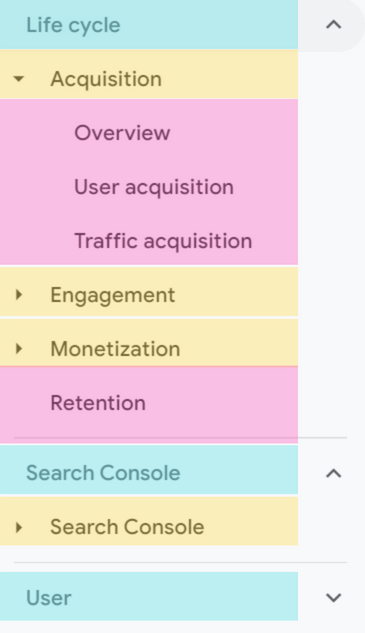
Report Hierarchy
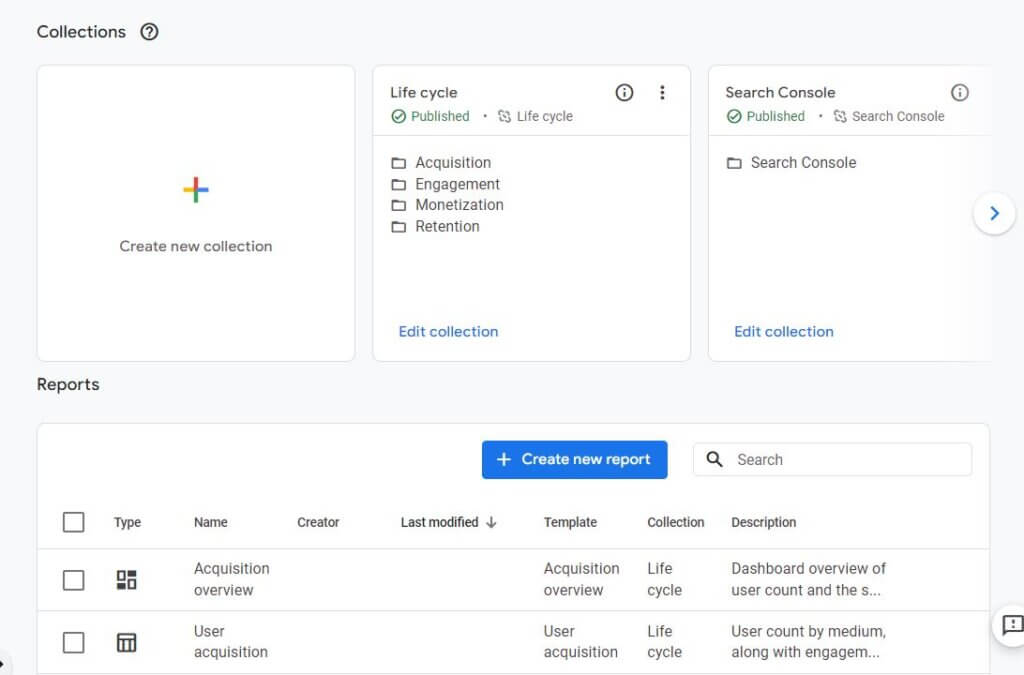
You should start by exploring these default reports, and learning about any changes in metrics and dimensions, to determine if any existing reports meet your needs. If not, click “Library” at the bottom of the report navigation panel, and customize your “Collections,” “Topics,” and “Reports” to meet your needs.
The left menu expands to show a hierarchy of Collections, Topics, and Reports. This menu is customizable, and you can add or remove components at any level.
Creating Reports
In the library, you can create new reports to add to the topics.
To create a new report, you’ll first need to choose whether you’re making an “overview report” or a “detail report.” Each topic can have only one overview report, and each detail report can contain up to two visualizations and one table. If you need more details beyond that, you should consider using Google Data Studio instead.
Because this process can be cumbersome and limited, we prefer to do most of our reporting and visualizations in Data Studio instead. It is more flexible and easier to duplicate the most useful reports across multiple properties.
Overview Reports
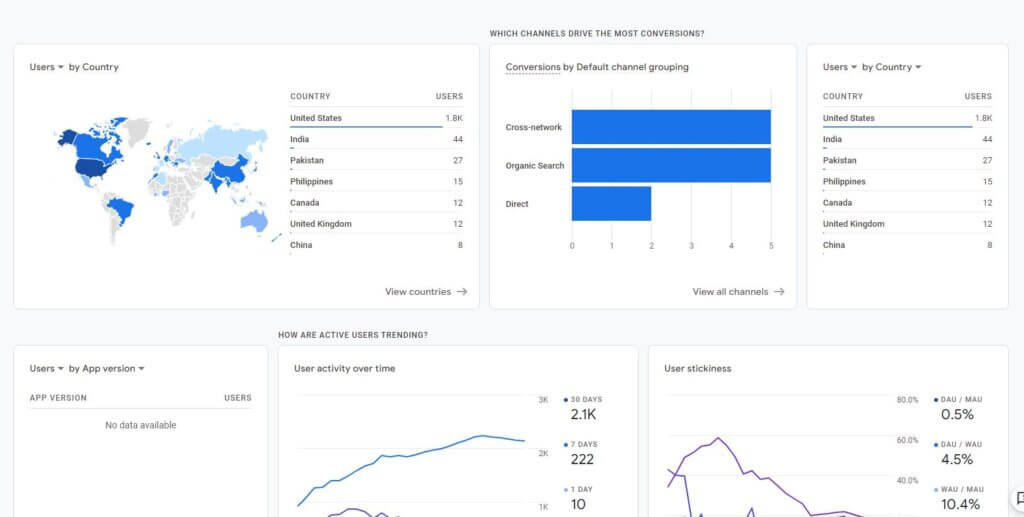
Overview reports consist of summary cards that are themed around a report topic. As you’re building your overview report, you’ll find a menu of cards to choose from, and some will have some additional customization options for metrics and dimensions.
You can add up to 16 cards per report, and the result is sort of like a dashboard where you can easily monitor simple charts consisting of one metric and one dimension.
Detail Reports
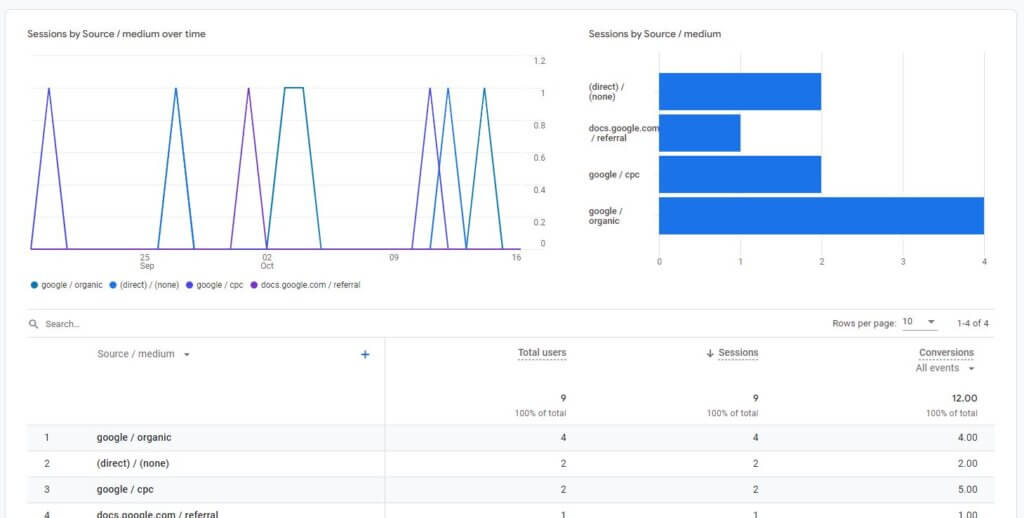
Detail reports give you more options, more flexibility, and more detail than overview reports. You will start by selecting the dimensions and metrics included in the report, along with any relevant filters. These are the fields that will be included in your detailed table, and the default options indicated will also be the ones shown in your two chart visualizations.
Next, you can select up to two chart types to include. Your choices are bar chart, scatter chart, and line chart.
You’ll have the option to build summary cards if you’d like, but you can skip this step if you don’t need them. These cards will be made from only the dimensions and metrics included in the detail report and won’t be visible in the detail report. They will be available in the overview report builder only.
Customizing the Report Menu
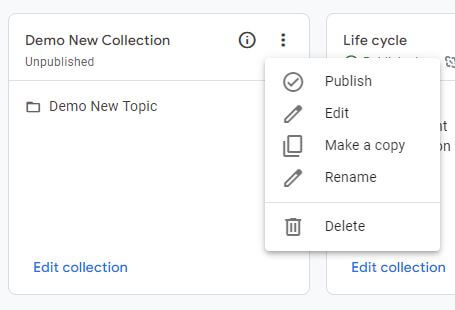
Once you’ve got your customized reports built, you can add them to the left navigation panel of collections, topics, and reports. Think about where your report might fit in among the existing collections and topics. If it isn’t relevant to any, you can create a new collection and a new topic. Publish your changes, and you’ll see your new reports in the left navigation panel.
The ability to customize the report navigation in the left panel can be really useful if you find yourself frequently needing to refer to simple reports that aren’t included by default. These reports, while simple, can often help you understand important things about your audience. Insights don’t have to be complicated to yield impactful results!