Google’s dashboard, Google Data Studio, is a far more powerful business dashboard tool than I think most people realize. I would argue it’s a contender for business intelligence dashboards next to some of the enterprise systems like Tableau and DOMO.
The main limitation with Google Data Studio is that you don’t have dozens of integrations out of the box. Since it’s a Google tool, it integrates seamlessly with Google Analytics, Google Ads, Google Search Console, etc. You do have to pay for a connector to integrate with most other platforms, however, that isn’t problematic when you compare that you could spend $40,000+ on an enterprise dashboard platform.
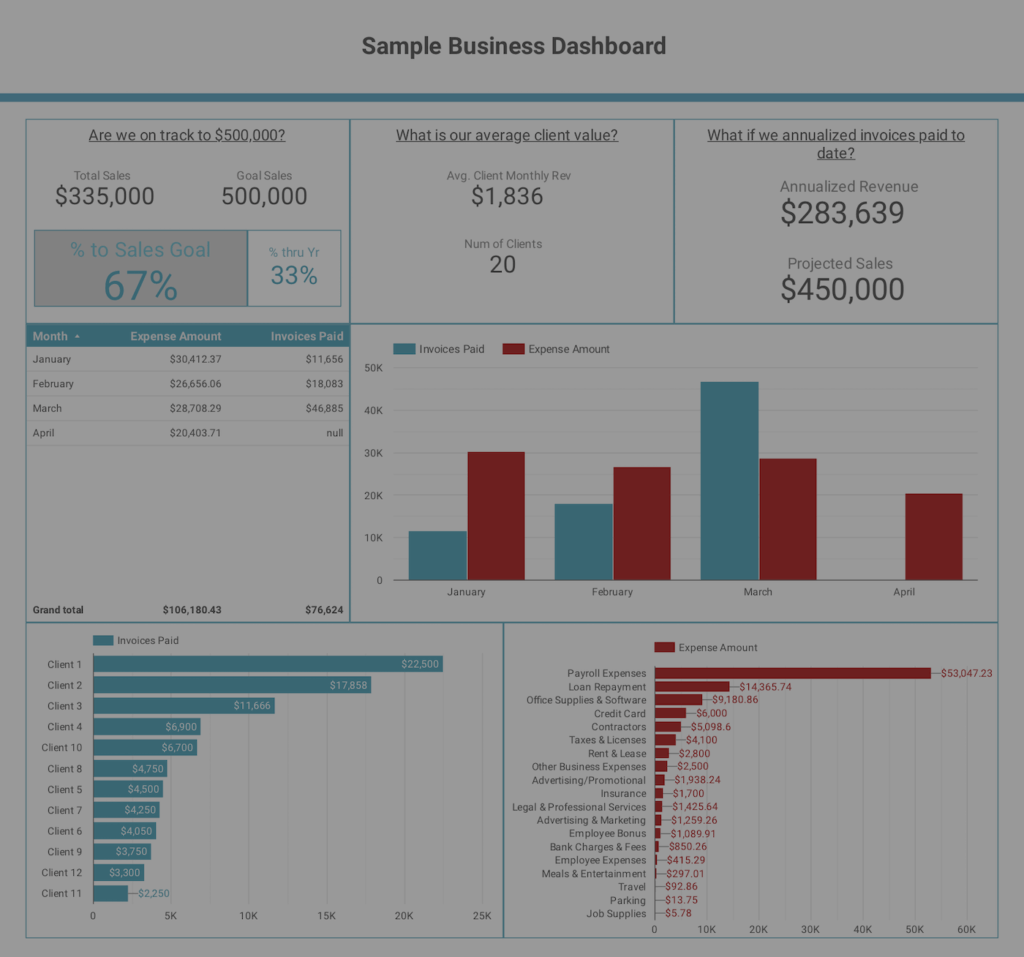
One of the more powerful integrations I’ve made in Google Data Studio so far is with Quickbooks Online. In the dashboard below, I used Zapier to incorporate sales projections next to revenue and expenses pulled straight from Quickbooks Online.
What’s Needed for This Dashboard?
All of the platforms and tools used for this dashboard include:
- Google Data Studio
- Google Sheets
- Quickbooks Online
- Zapier
Step 1: Set up Your Google Sheets Spreadsheet
Create a Google Sheet where you can store all of your Quickbooks Online data. In order to complete this step, do the following:
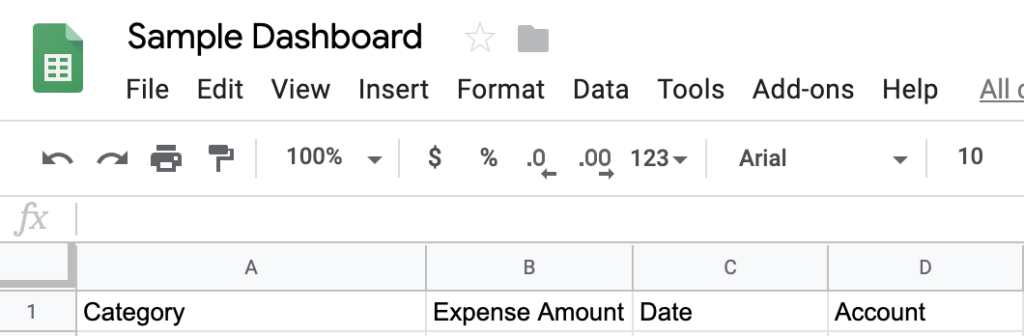
- Create two sheets within one spreadsheet — one sheet for your expenses and one for your invoices/sales revenue. Label them appropriately.
- Add headers for your columns on both sheets. Name each column based on the type of data you’d like to import from Quickbooks Online.
- For expenses, you may want to include:
- Expense Amount
- Expense Category
- Expense Date
- Expense Account
- For invoices/sales, you may want to include:
- Customer/Client Name
- Invoice/Sales Amount
- Date Paid
- Invoice Number
- Invoice Date Sent
- Invoice Date Due
- For expenses, you may want to include:
Your column headings should look something like this on your sheet:
Step 2: Create a Zapier Account
This is the only portion of this process that costs money, but it’s well worth it for what Zapier can provide. You only need the base-level paid model, which is $20/mo as of this publication, and your first month is free.
Zapier is basically your API developer. You know, the developer that you either can’t afford to employ to begin with, or you can’t prioritize this type of project above their existing workload. Within Zapier, you are able to set up “Zaps” that let your 3rd-party tools talk to each other.
In this case, we’re going to have Quickbooks Online talk to Google Sheets.
Step 3: Create Two Zaps
I recommend using Zapier’s guide for how to set up a Zap to complete this step.
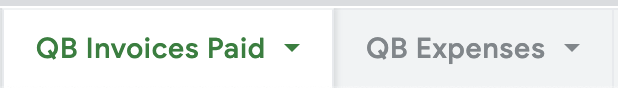
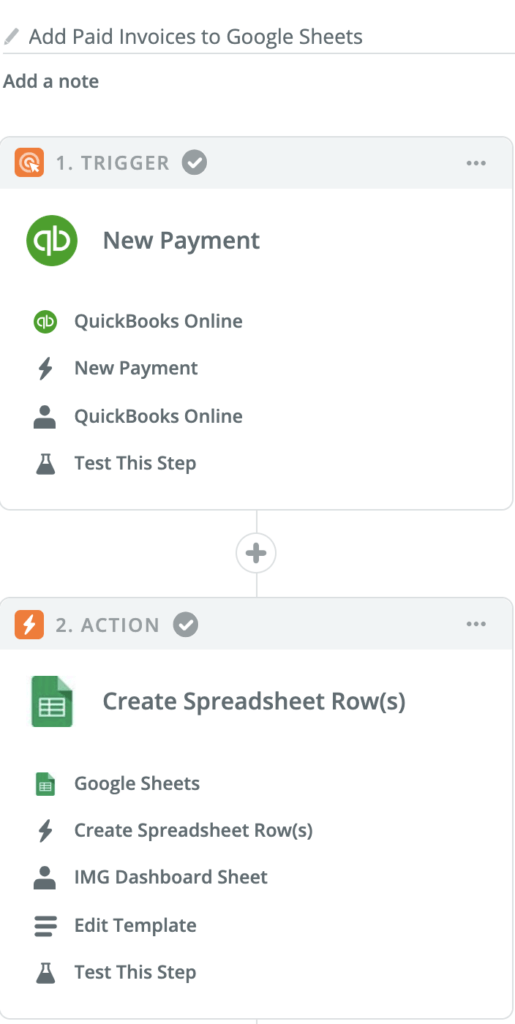
You will create two zaps. One zap will connect your Quickbooks expenses to your Google sheet that you set up with your expense headings. The other zap will do the same but for your Google sheet with invoice/sales revenue headings.
Our Sample Dashboard creates a zap whenever a new payment is registered in Quickbooks Online. The action we create is adding a new row to the sheet.
As you go through this process, you will be able to test the integration to make sure the data flows into your Google Sheet.
The flow is as follows:
Step 4: Set Up a Google Data Studio Report
Within Google Data Studio, select “Start a new report.” You can start with a template if you find one you like, or you can use a blank template and play around with the design. You can use our sample dashboard above as a guide for creating your initial visualizations.
The important thing is that you have a report open where you can start adding data sources and building charts.
Step 5: Add Google Sheets Data Sources
You now have all of the Quickbooks data you need to visualize the automatic flow into your Google Sheet, so it’s time to pull that into Google Data Studio.
Google has provided a thorough tutorial on how to add Google Sheets as a data source to Google Data Studio. Carefully walk through this process to create TWO data sources: one that connects to your expenses sheet and one that connects to your invoices/sales revenue sheet.
Keep in mind that since you are working from a Google Sheet, you are able to create any additional metrics. This can be as detailed or as basic as you want. One metric we like to show our clients is an “annualized revenue” KPI, where we take their gross income to date and use a multiplier based on how far through the fiscal year they are to calculate how current income trajectory looks if we don’t account for any revenue deviance throughout the rest of the year. We can also factor in any expected customer growth in this model.
Step 6: Create Your Charts!
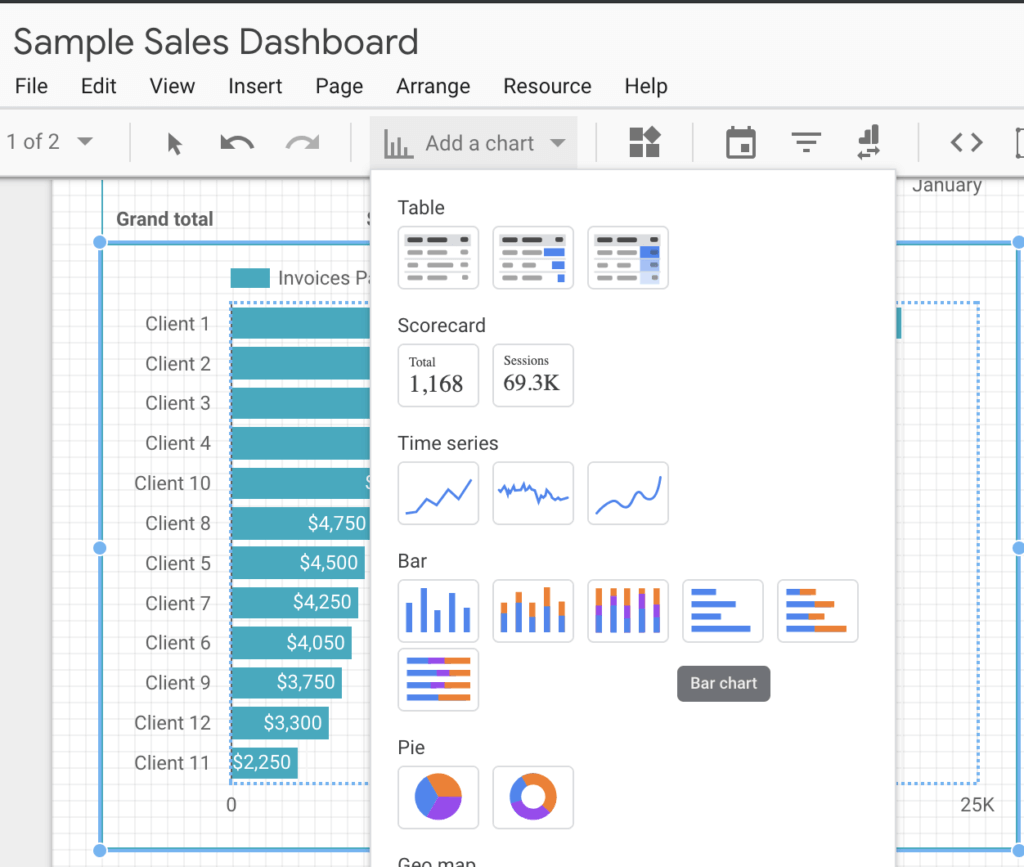
Finally, the fun part! You now have your Quickbooks Online data added to Google Data Studio, so it’s time to walk through setting up an example chart. We’ll start with the income/sales chart. Our example breaks down sales by client.
Select “Add a chart” and then choose a bar chart:
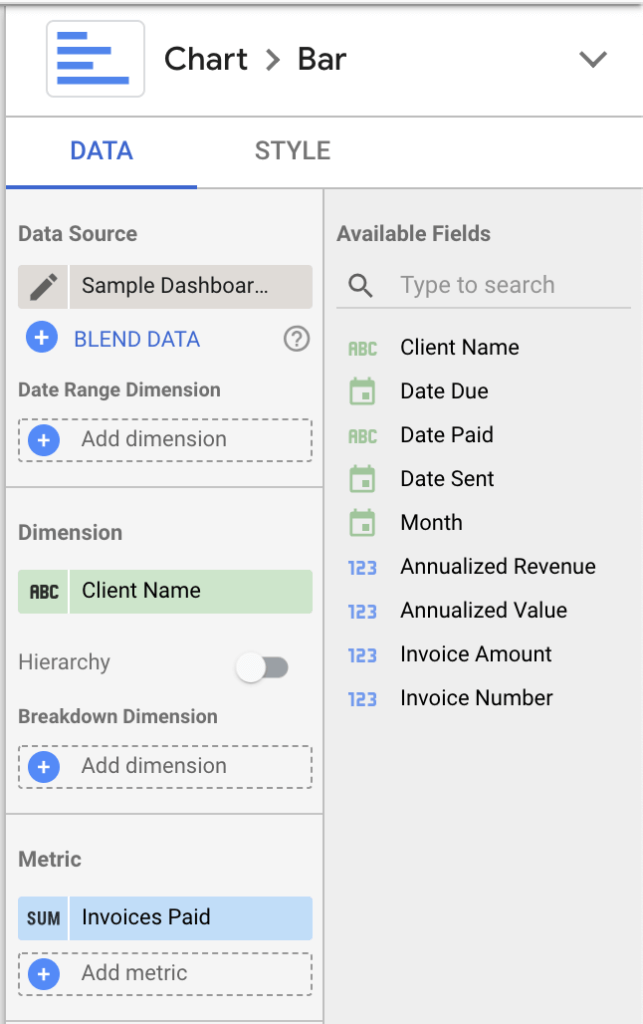
Select the income/sales revenue source that you added, and then choose the client name as your dimension and sales/invoices paid as your metric.
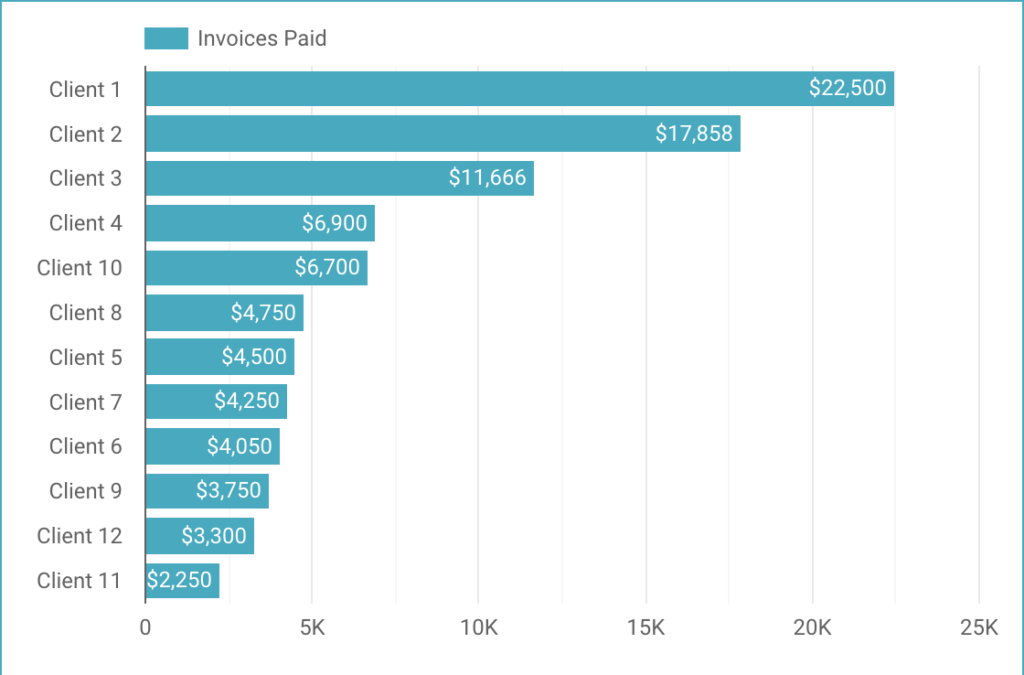
Your chart should look something like this:
Note: If you run into any trouble configuring your charts, use Google’s guide to creating charts in Google Data Studio.
You’re all set! You’re now on track to building out your starter Google dashboard.
What’s Next for My Dashboard?
If you didn’t happen to stumble upon this guide as a data analyst yourself, you may still be in need of some direction. Please don’t hesitate to contact us with any questions you may have. Also, feel free to take a look at our Business Analytics services, or view our digital marketing dashboard case studies for further inspiration.
We’d love to partner with you to take your analytics and insights to the next level so get in touch for your free consultation!