Every Izell Marketing Group client gets their very own dashboard to make it easy to monitor how their ads are performing. We start with a very simplified and time-saving view of the cost and performance data from ad platforms – Google, Facebook, Bing, Pinterest, LinkedIn, etc. – but creating and maintaining the dashboard is an iterative process, evolving based on the client’s questions, needs, and their level of interest in the PPC process.
We also incorporate data from Google Analytics into the dashboard, particularly if the client is using multiple ad platforms. Looking at results data through Google Analytics for on-site conversions and behavior allows for equivalent analysis of each ad platform with an “apples to apples” look, since each ad platform reports and measures conversions differently.
Dashboards
Our dashboard tool of choice is Google Data Studio because it is free and easily connects to Google Analytics and Google Ads. We love using SuperMetrics for Data Studio to connect other ad platforms like Bing Ads, LinkedIn Ads, Facebook and Instagram Ads, and Pinterest Ads. SuperMetrics also has a Google Analytics connector that lets you show multi-channel funnel data in your dashboard which is really helpful for clients selling products with a longer path to conversion.
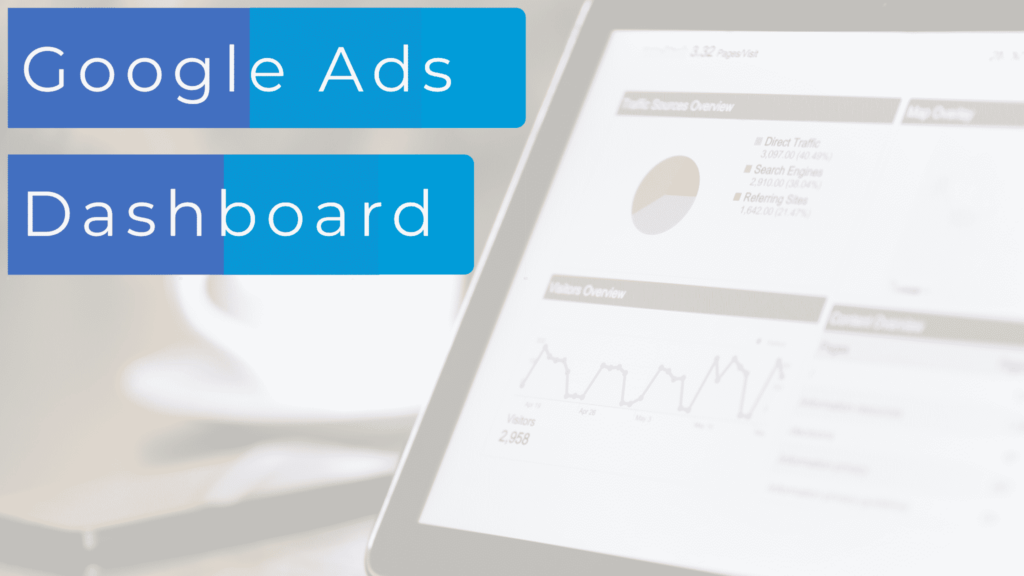
Example dashboards
Here are some examples of Google Ads dashboard pages we have created for clients:

Dimensions & Metrics
When you’re analyzing data from any of these sources within Data Studio, you’ll see many different fields, and these are either dimensions or metrics. Dimensions are categories or descriptions, and metrics are the values (think numbers) that measure each category or dimension. Keep this basic data structure in mind when you’re building your dashboards.
These fields will be available when you’re creating charts and tables in your dashboard to show how ads are performing. If you’ve already been creating and optimizing ad campaigns, you know what fields you should consider when analyzing and reporting performance, but if you’re new to the world of PPC like I was, here’s a crash course in some common ones that can be very useful!
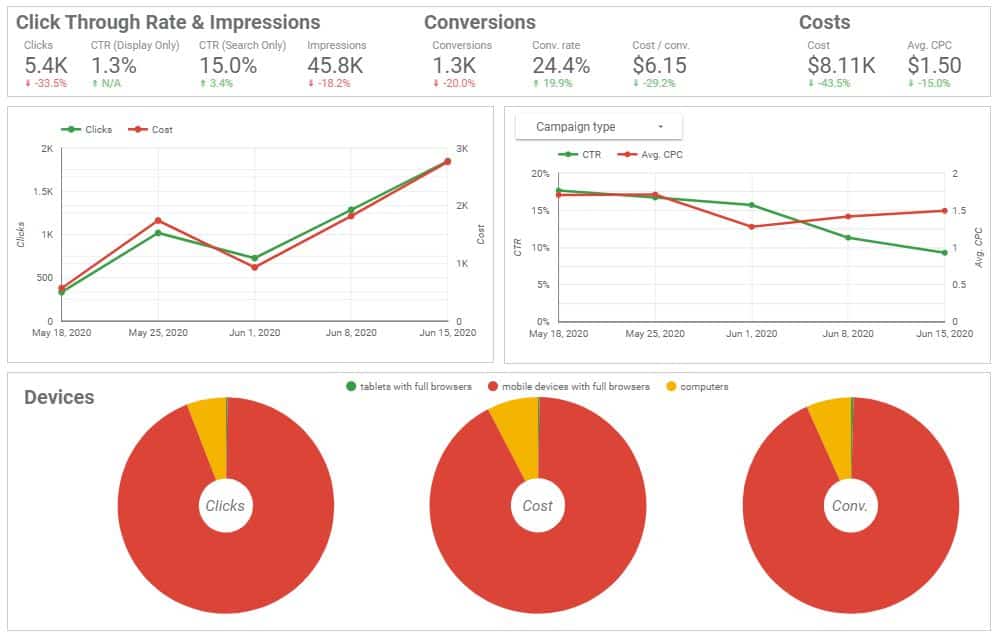
Every ad platform groups ads into Campaigns (hint: this is a category or label, aka dimension). These campaigns will have metrics like Impressions, Clicks, Cost Per Click, Click-Through Rates, and Cost associated with it. We always include these basic fields in our dashboards. Be aware that sometimes these have slight variations in the name from platform to platform. For example, what Google Ads calls Cost is called Amount Spent in Facebook Ads. Don’t worry, you’ll get the hang of it!
Data Studio also lets you add a date range control to each page, and we typically default to a rolling view of the past 30 days. For longer term and year-over-year reporting, we will look at data by week and by month to see overall trends, but for the sake of consistency with a real-time dashboard, we prefer a 30 day view. The control allows the viewer to change the date range interactively.
Platform Specific Fields
Beyond these basic fields, each platform has other dimensions and metrics that may be useful. For example, campaigns on Facebook Ads have Objective, which can be topics like lead generation, website traffic, or conversions. These objectives use different metrics to measure results. For example, ads on Facebook and LinkedIn use forms to collect leads, and Google and Bing Ads can count the number of phone calls directly from the ad. Knowing the objective of the ad and the different possible results is very helpful in showing the full picture of the campaign’s performance in a client-facing dashboard! Other dimensions to consider include Campaign Type in Google ads and Placement in Facebook Ads. These are great to use as filters or filter controls to get specific in the dashboard or add interactivity with dropdown menus.
Continue Your Learning:
Check out these links to see all the different fields you can use in your dashboard with the SuperMetrics connectors:
Facebook Ads (SuperMetrics Connector)
Bing Ads (SuperMetrics Connector)
LinkedIn Ads (SuperMetrics Connector)
Pinterest Ads (SuperMetrics Connector)
Google Ads (SuperMetrics Connector)
Google Analytics (SuperMetrics Connector)
You’ll be able to customize dashboards for your own analysis and to report on performance to clients. This makes transparency and reporting easy! Don’t feel intimidated by all the different options; you can start simple and build it out to suit your needs and the needs of your clients.